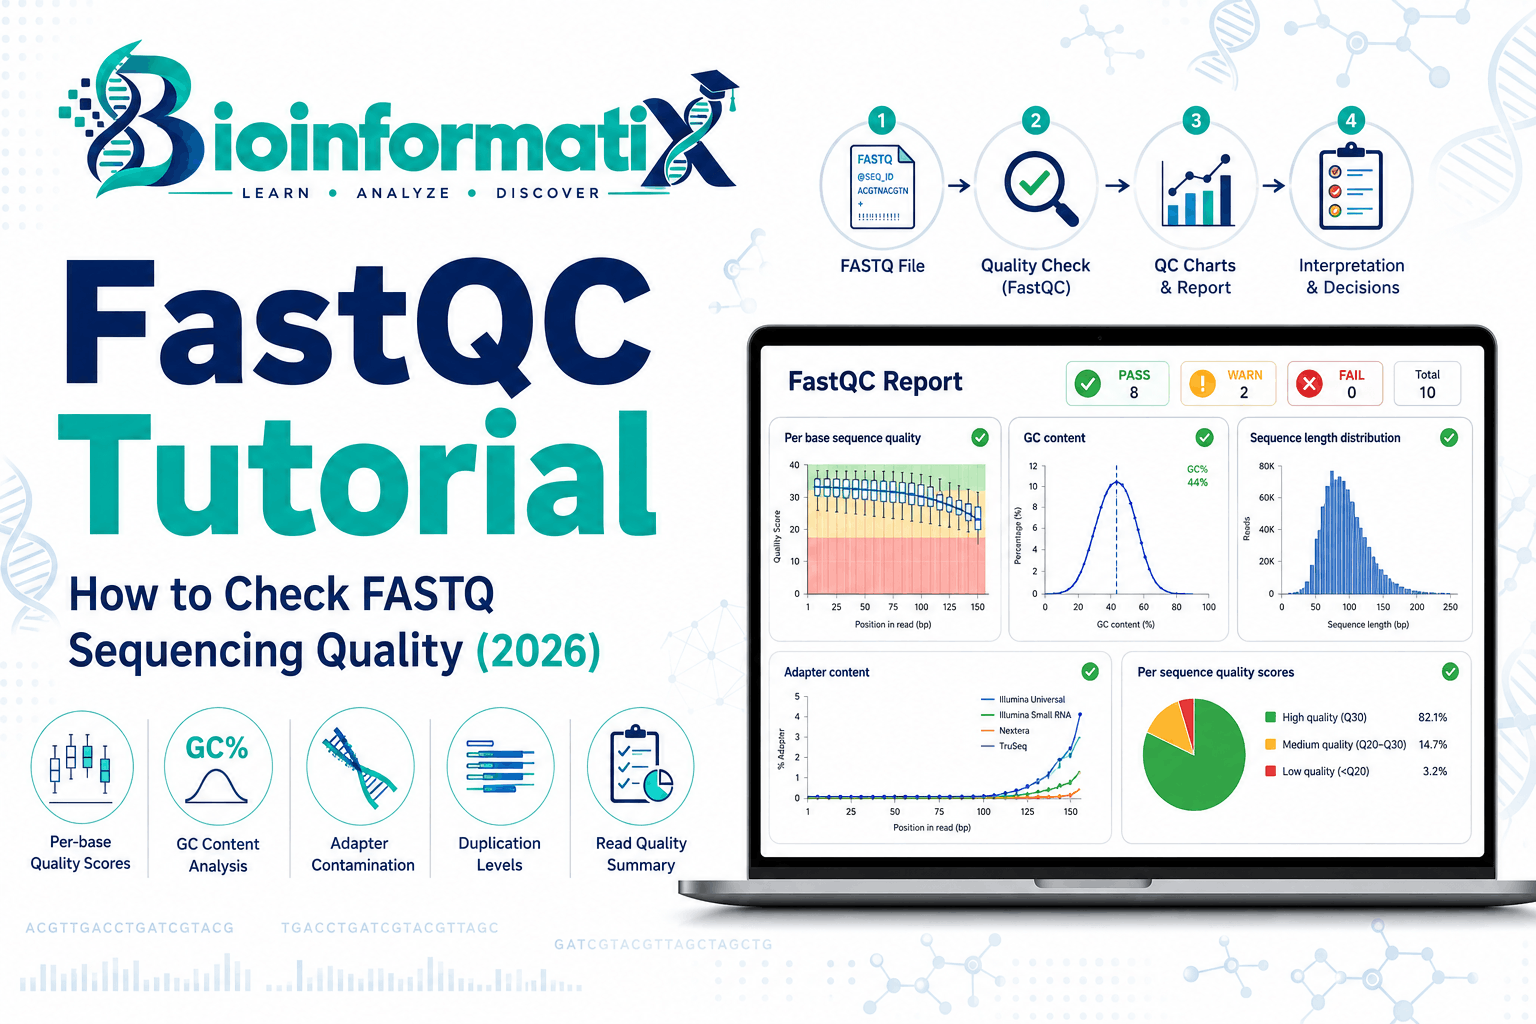
This FastQC Tutorial explains how to evaluate the quality of FASTQ sequencing files before beginning downstream next-generation sequencing analysis. Whether you are working with RNA-Seq, whole-genome sequencing, variant calling, metagenomics, ChIP-Seq, or other NGS datasets, quality control should be one of the first computational steps in your workflow.
Modern sequencing platforms can generate millions or billions of reads. However, raw sequencing data may contain low-quality bases, adapter sequences, unexpected sequence composition, duplicated reads, or other technical characteristics that can influence downstream analysis.
FastQC provides a quick visual summary of these properties.
For an NGS analyst, the important skill is not simply running FastQC. You must understand what each FastQC graph means, which warnings matter, which failures may be expected for a particular experiment, and what action—if any—you should take next.
In this complete beginner-friendly FastQC Tutorial, you will learn:
- What FastQC is
- Why FASTQ quality control matters
- How FASTQ quality scores work
- How to install FastQC
- How to run FastQC from Linux
- How to analyze paired-end sequencing data
- How to interpret every major FastQC module
- What PASS, WARN, and FAIL mean
- How to detect adapter contamination
- How to interpret sequence duplication
- How RNA-Seq, WGS, variant calling, and metagenomics FastQC reports differ
- When trimming is actually required
- How to run FastQC after trimming
- How to summarize multiple FastQC reports with MultiQC
- Common FastQC mistakes
- How FastQC fits into complete NGS pipelines
If you are new to sequencing, first read our What Is Next-Generation Sequencing (NGS)? Complete Beginner’s Guide.
FastQC Tutorial: What Is FastQC?
FastQC is a quality-control application developed for high-throughput sequencing data.
Its purpose is to rapidly inspect sequencing files and identify characteristics that may require attention before downstream analysis.
The official FastQC website describes FastQC as a modular quality-control tool that provides graphical and tabular summaries of high-throughput sequencing data. It can analyze FASTQ as well as several alignment-file formats and can generate standalone HTML reports for automated workflows.
FastQC does not:
- Align sequencing reads
- Trim adapters
- Remove low-quality reads
- Quantify genes
- Call variants
- Perform differential expression
Instead, it answers a more fundamental question:
What does the quality and composition of my sequencing data look like?
The answer helps determine what preprocessing, if any, should happen next.
Why Is FASTQ Quality Control Important?
Imagine beginning an RNA-Seq or variant-calling pipeline without checking the raw sequencing reads.
If the data contain substantial technical problems, those problems can propagate through the entire analysis.
Potential consequences include:
- Poor alignment rates
- Incorrect gene quantification
- False-positive variants
- Missed variants
- Reduced assembly quality
- Biased abundance estimates
- Increased computational processing
- Misleading biological conclusions
A good NGS workflow therefore typically begins with:
Raw FASTQ
↓
Quality Control
↓
Evaluate Problems
↓
Preprocess if Necessary
↓
Quality Control Again
↓
Downstream Analysis
Quality control is not merely a checkbox.
It is a decision-making stage.
What Is a FASTQ File?
Before learning FastQC, you should understand what the tool is examining.
A FASTQ file contains sequencing reads together with quality scores.
A simplified FASTQ record looks like:
@READ_001
ACGTGCTAGCTAGCTAGCTA
+
FFFFFFFFFFFFFFFFFFFF
Each read normally contains four lines.
Line 1: Read Identifier
@READ_001
Identifies the sequencing read.
Line 2: Sequence
ACGTGCTAGCTAGCTAGCTA
Contains the nucleotide sequence.
Line 3: Separator
+
Separates the sequence from its quality string.
Line 4: Quality Scores
FFFFFFFFFFFFFFFFFFFF
Encodes the estimated quality of each sequenced base.
FastQC analyzes these reads collectively to detect trends in sequencing quality and sequence composition.
What Are Phred Quality Scores?
Sequencing quality is commonly represented using Phred quality scores.
The Phred score is related to the estimated probability that a base call is incorrect.
A commonly used relationship is:
Q = -10 log10(P)
where:
Q= Phred quality scoreP= estimated probability of an incorrect base call
For example:
| Phred Score | Approximate Error Probability | Approximate Base Accuracy |
|---|---|---|
| Q10 | 1 in 10 | 90% |
| Q20 | 1 in 100 | 99% |
| Q30 | 1 in 1,000 | 99.9% |
| Q40 | 1 in 10,000 | 99.99% |
This is why Q30 is frequently mentioned when discussing high-quality sequencing data.
However, FastQC should not be interpreted by applying one universal Q30 rule to every experiment.
The expected quality profile depends on:
- Sequencing platform
- Read length
- Sequencing chemistry
- Library preparation
- Experimental design
Where Does FastQC Fit in an NGS Pipeline?
FastQC usually appears immediately after obtaining FASTQ files.
For example, an RNA-Seq workflow may look like:
FASTQ
↓
FastQC
↓
Adapter / Quality Processing if Required
↓
FastQC
↓
STAR or HISAT2
↓
BAM
↓
featureCounts
↓
Count Matrix
↓
Differential Expression
For practical training in the complete transcriptomics workflow, explore:
Hands-On RNA-Seq Analysis: From FASTQ to Differential Expression
A genomic variant-analysis workflow might look like:
FASTQ
↓
FastQC
↓
Read Processing if Required
↓
BWA Alignment
↓
BAM
↓
Variant Calling
↓
VCF
↓
Variant Annotation
For this pathway, continue with:
Learn Variant Calling: NGS Data Analysis
You can also read our Variant Calling Explained: Complete NGS Variant Analysis Guide.
FastQC Tutorial: How to Install FastQC
FastQC can be installed in several ways.
The official FastQC distribution is available from the Babraham Bioinformatics FastQC page.
FastQC is written in Java, and the official software page notes that a suitable Java runtime is required.
For bioinformatics workflows on Linux, package managers such as Conda or Mamba are often convenient.
Install FastQC with Conda
If you use Conda:
conda install -c conda-forge -c bioconda fastqc
Then verify the installation:
fastqc --version
You should see the installed FastQC version.
Install FastQC with Mamba
If you use Mamba:
mamba install -c conda-forge -c bioconda fastqc
Mamba is often faster at resolving bioinformatics software environments.
Check FastQC Help
Use:
fastqc --help
to see available command-line options.
FastQC Tutorial: How to Run FastQC on a FASTQ File
Suppose your directory contains:
sample1.fastq.gz
Run:
fastqc sample1.fastq.gz
FastQC can directly analyze gzip-compressed FASTQ files, so you generally do not need to decompress .fastq.gz files first. The official FastQC documentation lists gzip-compressed FASTQ among its supported input formats.
After FastQC completes, you will usually obtain files such as:
sample1_fastqc.html
sample1_fastqc.zip
The HTML file contains the interactive report you normally inspect.
Running FastQC on Multiple FASTQ Files
If your folder contains several FASTQ files:
sample1.fastq.gz
sample2.fastq.gz
sample3.fastq.gz
sample4.fastq.gz
you can run:
fastqc *.fastq.gz
FastQC will generate a separate report for each file.
Running FastQC with Multiple Threads
For several large sequencing files, you can specify multiple threads.
For example:
fastqc -t 4 *.fastq.gz
This asks FastQC to process files using multiple worker threads.
Choose the thread count according to the computational resources available on your system.
Save FastQC Reports to a Separate Directory
First create a directory:
mkdir fastqc_results
Then run:
fastqc -o fastqc_results *.fastq.gz
Now your project remains organized:
project/
│
├── raw_data/
│   ├── sample1.fastq.gz
│   └── sample2.fastq.gz
│
└── fastqc_results/
    ├── sample1_fastqc.html
    ├── sample1_fastqc.zip
    ├── sample2_fastqc.html
    └── sample2_fastqc.zip
Good directory organization becomes increasingly important as NGS projects grow.
FastQC Tutorial for Paired-End Sequencing
Paired-end sequencing normally generates two FASTQ files for each sample.
For example:
sample1_R1.fastq.gz
sample1_R2.fastq.gz
Run FastQC on both files:
fastqc sample1_R1.fastq.gz sample1_R2.fastq.gz
or:
fastqc *.fastq.gz
You will receive separate reports for:
sample1_R1
sample1_R2
This is important because R1 and R2 can have different quality profiles.
For example, R2 may sometimes show a stronger quality decrease near the end of the read than R1.
Never inspect only R1 and assume R2 is identical.
Understanding PASS, WARN and FAIL in FastQC
Each FastQC module receives a summary status.
You may see:
PASS
Usually represented by a green check mark.
WARN
Usually represented by an orange warning symbol.
FAIL
Usually represented by a red failure symbol.
A common beginner mistake is thinking:
Every red FastQC module means the sequencing dataset is unusable.
That is incorrect.
FastQC applies predefined heuristics.
Certain sequencing applications naturally violate those expectations.
For example:
- RNA-Seq may show sequence-composition bias
- Amplicon sequencing can show extremely high duplication
- Small RNA sequencing may contain substantial adapter signal
- Metagenomic samples may have unusual GC distributions
- Highly expressed RNA transcripts can increase duplication
- Trimmed datasets may have variable read lengths
Therefore:
PASS ≠ automatically perfect
and:
FAIL ≠ automatically unusable
The correct interpretation depends on the experiment.
The official FastQC documentation emphasizes that the tool provides a rapid overview of areas where potential problems may exist; these modules need to be interpreted in context rather than treated as absolute biological judgments.
FastQC Tutorial: Understanding the FastQC Report
FastQC reports contain several modules.
The exact set may depend on the data and software version, but commonly encountered modules include:
- Basic Statistics
- Per Base Sequence Quality
- Per Tile Sequence Quality
- Per Sequence Quality Scores
- Per Base Sequence Content
- Per Sequence GC Content
- Per Base N Content
- Sequence Length Distribution
- Sequence Duplication Levels
- Overrepresented Sequences
- Adapter Content
Let’s examine each one.
1. Basic Statistics
The Basic Statistics section provides an overview of the input file.
Information may include:
- Filename
- File type
- Sequence quality encoding
- Total sequences
- Total bases
- Poor-quality sequences
- Sequence length
- GC percentage
For example:
Filename: sample_R1.fastq.gz
Total Sequences: 25,000,000
Sequence Length: 150
%GC: 48
This section provides useful context before examining the more detailed graphs.
What Should You Check in Basic Statistics?
Verify:
Correct Filename
Make sure you analyzed the intended sample.
Number of Reads
Unexpectedly low read counts may indicate:
- Incomplete downloads
- Failed sequencing
- Incorrect files
- Earlier filtering
Read Length
If the experiment was expected to generate 150-bp reads but the report shows something very different, investigate.
GC Content
GC percentage should make biological sense for the organism and experiment.
However, do not judge GC content using one universal expected percentage.
2. Per Base Sequence Quality
Per Base Sequence Quality is one of the most important FastQC graphs.
It displays the distribution of quality scores at each position along the read.
The x-axis represents:
Position in read
The y-axis represents:
Phred quality score
You may see box plots across each base position.
What Does a Good Per Base Quality Plot Look Like?
Generally, you want most base positions to remain in the high-quality region.
A typical high-quality profile may show:
Read start → high quality
Middle → high quality
Read end → moderate decline
A gradual reduction near the 3′ end of longer reads is relatively common.
What If Quality Drops at the Read End?
Suppose your 150-bp reads show:
Bases 1–120:
high quality

Bases 121–150:
progressive decline
Possible actions include:
- Evaluate whether the downstream aligner tolerates the profile
- Perform quality trimming if justified
- Use a tool such as fastp or Cutadapt
- Compare alignment performance
Do not automatically trim all bases below an arbitrary value without considering the downstream pipeline.
Modern aligners often use base-quality information and can tolerate some low-quality bases.
3. Per Tile Sequence Quality
The Per Tile Sequence Quality module examines whether specific regions of the sequencing flow cell show consistently different quality.
This can help reveal localized instrument-related problems.
Ideally, quality should be relatively uniform across sequencing tiles.
Strong localized patterns may suggest:
- Flow-cell imaging problems
- Instrument issues
- Local sequencing chemistry problems
This module may not be present or equally informative for every sequencing technology.
4. Per Sequence Quality Scores
The Per Sequence Quality Scores module summarizes the mean quality score for each read.
Instead of asking:
How good is base position 100?
it asks:
How good is each entire sequencing read on average?
Ideally, the distribution should be concentrated toward higher quality scores.
If a substantial group of reads has very low average quality, you may need to investigate:
- Sequencing performance
- Read filtering
- Sample-specific problems
5. Per Base Sequence Content
The Per Base Sequence Content graph shows the proportion of:
A
C
G
T
at each position across all sequencing reads.
For a random genomic library, nucleotide proportions may become relatively stable across most of the read.
However, strong differences near the beginning of reads can occur for biological or library-preparation reasons.
Why Can RNA-Seq Fail Per Base Sequence Content?
RNA-Seq libraries can show non-random sequence composition near the start of reads because of factors such as library preparation and priming biases.
Therefore, a warning or failure here does not automatically mean your RNA-Seq experiment is poor.
This is a good example of why FastQC modules must be interpreted according to assay type.
If you are analyzing RNA-Seq data, continue with our RNA-Seq Explained: Complete Beginner’s Guide.
6. Per Sequence GC Content
This module displays the GC-content distribution across individual sequencing reads.
For a relatively homogeneous genomic library, the observed distribution may resemble a smooth expected distribution.
Unexpected peaks can potentially indicate:
- Contamination
- Mixed organisms
- Library bias
- Overrepresented sequence populations
But context is critical.
GC Content in Metagenomics
In metagenomic sequencing, your sample may contain many organisms with different genome compositions.
Therefore:
one simple normal GC distribution
may not be expected.
A complex GC distribution can reflect real biological diversity.
This is another case where a FastQC warning is not automatically evidence of poor data.
For microbial-community analysis, explore:
Master Metagenomics and Microbiome Data Analysis Using Linux
The course provides a practical pathway for learners who want to progress from raw sequencing data into microbial-community analysis.
7. Per Base N Content
Sometimes a sequencing instrument cannot confidently determine whether a position is:
A
C
G
or
T
The base may instead be reported as:
N
The Per Base N Content module shows the percentage of ambiguous N bases at each read position.
Ideally, this should remain low.
A substantial increase may indicate poor base calling or problematic sequencing cycles.
8. Sequence Length Distribution
This module shows how sequencing read lengths are distributed.
For an untrimmed fixed-length sequencing run, you might expect:
150 bp
150 bp
150 bp
150 bp
After trimming, you may instead see:
150 bp
148 bp
143 bp
137 bp
121 bp
...
That does not automatically indicate a problem.
Variable sequence lengths may be expected after:
- Adapter trimming
- Quality trimming
- Protocol-specific processing
- Certain sequencing technologies
Interpret the graph according to how the FASTQ files were generated.
9. Sequence Duplication Levels
The Sequence Duplication Levels module estimates how often identical or highly repeated sequences occur in the dataset.
High duplication can sometimes indicate:
- PCR amplification
- Low library complexity
- Over-sequencing
But high duplication can also be biologically expected.
Sequence Duplication in RNA-Seq
Suppose one transcript is extremely highly expressed.
Many independent RNA molecules can produce identical or similar sequence reads.
Therefore, duplication in RNA-Seq does not necessarily represent PCR artifacts.
Highly expressed transcripts naturally generate many repeated reads.
This means:
Do not automatically remove duplicate reads from RNA-Seq simply because FastQC reports high duplication.
Duplicate interpretation depends on library type and experimental design.
Sequence Duplication in Variant Calling
For genomic DNA sequencing, excessive duplication may reduce the amount of independent information available for variant discovery.
Variant-calling pipelines may therefore include duplicate marking depending on library preparation and workflow.
Read our Variant Calling Explained guide for the broader FASTQ-to-VCF pipeline.
10. Overrepresented Sequences
The Overrepresented Sequences module identifies sequences occurring much more frequently than expected.
Possible sources include:
- Sequencing adapters
- PCR primers
- Highly abundant transcripts
- Ribosomal RNA
- Contaminants
- Library-specific sequences
FastQC may attempt to identify known sequence types where possible.
Example: Adapter Sequence
Suppose a sequencing insert is shorter than the read length.
The sequencer may read through the biological fragment and begin sequencing the adapter.
Conceptually:
Biological Insert:
ACGTACGTACGT

Adapter:
AGATCGGAAGAGC
The resulting read may contain:
ACGTACGTACGTAGATCGGAAGAGC
If this occurs in many reads, adapter sequence may appear as overrepresented sequence content.
11. Adapter Content
The Adapter Content module shows whether known adapter sequences appear across the sequencing reads.
Ideally, adapter content should remain low.
An increase near the 3′ end may indicate read-through into sequencing adapters.
For example:
Beginning of read:
little adapter signal

End of read:
increasing adapter signal
This commonly occurs when:
sequencing read length
>
biological insert length
Should You Trim Adapter Sequences?
If genuine adapter contamination is present, adapter trimming is generally appropriate before many downstream analyses.
Common tools include:
- fastp
- Cutadapt
- Trimmomatic
For example, your workflow may become:
Raw FASTQ
↓
FastQC
↓
Adapter Contamination Detected
↓
Cutadapt / fastp
↓
Trimmed FASTQ
↓
FastQC Again
↓
Downstream Analysis
The second FastQC run verifies whether the intended preprocessing actually improved the problem.
FastQC Before and After Trimming
A strong QC workflow normally preserves reports from both stages.
For example:
01_raw_fastqc/
02_trimmed_reads/
03_trimmed_fastqc/
This makes it possible to compare:
Before Trimming
- Adapter content
- End-of-read quality
- Overrepresented sequences
After Trimming
- Adapter removal
- Quality improvement
- Read-length changes
- Remaining issues
Do not delete your original QC reports.
They form part of your analysis record.
Should You Always Trim Low-Quality Reads?
No.
This is one of the most important lessons in this FastQC Tutorial.
The workflow should not automatically be:
FASTQ
↓
Trim everything
↓
Analysis
Instead:
FASTQ
↓
FastQC
↓
Understand the QC profile
↓
Decide whether preprocessing is justified
Unnecessary aggressive trimming can:
- Shorten reads
- Reduce mapping uniqueness
- Remove useful sequence
- Reduce effective coverage
The goal is not to make every FastQC symbol green.
The goal is to produce data suitable for the downstream biological analysis.
FastQC for RNA-Seq
For RNA-Seq, pay particular attention to:
- Per Base Sequence Quality
- Adapter Content
- Overrepresented Sequences
- Sequence Duplication
- Per Base Sequence Content
- GC Content
However, remember:
High Duplication
May reflect genuinely abundant transcripts.
Sequence Content Bias
May reflect library-preparation characteristics.
Overrepresented Sequences
Could include highly expressed biological transcripts as well as technical contaminants.
A red symbol therefore requires interpretation, not panic.
For a complete RNA-Seq pipeline, see:
Hands-On RNA-Seq Analysis: From FASTQ to Differential Expression
and read our RNA-Seq Explained guide.
FastQC for Whole Genome Sequencing
For WGS, important considerations include:
- Overall read quality
- Adapter contamination
- Duplication
- GC distribution
- Sequence quality toward read ends
The typical workflow is:
FASTQ
↓
FastQC
↓
Preprocessing if Required
↓
BWA
↓
BAM
↓
Variant Calling
↓
VCF
Read our Whole Genome Sequencing Explained article for the complete genomic pipeline.
FastQC for Variant Calling
Poor FASTQ quality can affect variant calling because genomic variants are inferred from sequencing evidence.
Potential issues include:
Low-Quality Bases
May introduce false mismatches.
Adapter Contamination
Can reduce alignment performance.
Poor Mapping
Can generate misleading variant evidence.
Excessive Duplication
Can reduce effective independent genomic coverage.
FastQC is therefore one of the earliest safeguards in a variant-discovery workflow.
For hands-on training:
Learn Variant Calling: NGS Data Analysis
This is the most directly relevant individual BioInformatix course for learners interested in FASTQ-to-VCF genomic analysis.
FastQC for Metagenomics
Metagenomic datasets require particularly careful interpretation.
A metagenomic sample may contain:
Bacteria
Archaea
Viruses
Fungi
Host DNA
Unknown organisms
Different organisms can have very different:
- GC content
- Sequence composition
- Relative abundance
Therefore, unusual GC distributions or sequence composition may reflect real community structure.
However, you should still investigate:
- Poor sequencing quality
- Adapter contamination
- Host contamination
- Technical overrepresentation
For practical microbial-community analysis, explore:
Master Metagenomics and Microbiome Data Analysis Using Linux
FastQC for Small RNA Sequencing
Small RNA libraries often contain very short biological inserts.
For example, mature miRNAs are much shorter than standard Illumina read lengths.
Therefore, sequencing can easily continue through:
small RNA insert
↓
adapter
Strong adapter contamination may therefore be expected before preprocessing.
Correct adapter removal is particularly important in small RNA workflows because read length is biologically meaningful.
Learners interested in miRNA sequencing can continue with:
Learn Advanced Transcriptomics: lncRNA, miRNA & Psi-Seq Data Analysis
FastQC Tutorial: How to Analyze Many Samples with MultiQC
Suppose your project contains 40 paired-end samples.
That means:
40 samples × 2 FASTQ files
=
80 FastQC reports
Opening 80 HTML files individually becomes inefficient.
This is where MultiQC becomes extremely useful.
MultiQC scans analysis output directories and combines recognized reports into a single interactive HTML summary. The current MultiQC documentation specifically supports FastQC outputs and can summarize multiple samples together.
Install MultiQC
Using Conda:
conda install -c conda-forge -c bioconda multiqc
or Mamba:
mamba install -c conda-forge -c bioconda multiqc
Run MultiQC
Suppose all your FastQC reports are stored inside:
fastqc_results/
Run:
multiqc fastqc_results/
Or move into your project directory and run:
multiqc .
MultiQC scans supported output files and generates a report such as:
multiqc_report.html
The official MultiQC documentation describes multiqc . as the basic command for scanning the current directory and generating a combined report.
Why Use MultiQC?
Instead of checking:
Sample01
Sample02
Sample03
Sample04
...
Sample80
one at a time, MultiQC allows you to identify:
- Samples with lower quality
- Adapter contamination across the cohort
- GC-content outliers
- Read-count differences
- Sequence-length differences
- Unexpected sample-specific behavior
This is particularly important for large RNA-Seq, WGS, and metagenomics projects.
Example FastQC and MultiQC Workflow
Suppose your directory contains:
Control1_R1.fastq.gz
Control1_R2.fastq.gz
Control2_R1.fastq.gz
Control2_R2.fastq.gz
Disease1_R1.fastq.gz
Disease1_R2.fastq.gz
Disease2_R1.fastq.gz
Disease2_R2.fastq.gz
Create a QC directory:
mkdir fastqc_results
Run FastQC:
fastqc -t 4 -o fastqc_results *.fastq.gz
Run MultiQC:
multiqc fastqc_results/
Now inspect:
multiqc_report.html
This gives you both:
individual FastQC reports
and:
one cohort-level MultiQC summary
What Should You Record from FastQC?
For reproducible analysis, maintain a basic QC record.
For example:
| Sample | Reads | Quality | Adapter | Duplication | Action |
|---|---|---|---|---|---|
| Control1 | 24M | Good | Low | Moderate | Keep |
| Control2 | 26M | Good | Moderate | Moderate | Trim adapters |
| Disease1 | 21M | Good | Low | High | Investigate |
| Disease2 | 25M | Poor 3′ end | Moderate | Moderate | Trim/QC again |
This is more useful than simply writing:
FastQC passed.
Quality control is a process of evidence and decisions.
Common FastQC Mistakes Beginners Should Avoid
Mistake 1: Treating Every FAIL as Fatal
FastQC thresholds are generic.
Some assay-specific characteristics naturally trigger warnings or failures.
Always interpret results in biological context.
Mistake 2: Trying to Make Every Module Green
The purpose of preprocessing is not to obtain an aesthetically perfect FastQC report.
The purpose is to prepare appropriate data for downstream analysis.
Mistake 3: Inspecting Only One Paired-End File
Always inspect both:
R1
and:
R2
because their quality profiles may differ.
Mistake 4: Trimming Without Looking at FastQC
Do not automatically run aggressive trimming before understanding the raw data.
Mistake 5: Ignoring Adapter Content
Significant read-through adapters can affect alignment and downstream analysis.
Mistake 6: Assuming High Duplication Is Always PCR Bias
RNA-Seq and other enrichment-based assays can show biologically meaningful duplication.
Mistake 7: Treating Metagenomic GC Content Like Human WGS
Metagenomics contains multiple organisms.
A complex GC distribution may be completely expected.
Mistake 8: Running FastQC Only Before Trimming
If preprocessing changes the reads, run quality control again.
Mistake 9: Ignoring Sample-to-Sample Differences
A single poor sample can affect downstream statistics.
This is why MultiQC is useful for cohort-level comparison.
Mistake 10: Removing Samples Based Only on FastQC
A FastQC warning alone is rarely sufficient reason to remove a biological sample.
Investigate:
- Sequencing metrics
- Mapping rates
- Sample metadata
- Experimental design
- Downstream QC
before making exclusion decisions.
FastQC Does Not Detect Every NGS Problem
FastQC is extremely useful, but it is not a complete sequencing-quality solution.
FastQC primarily examines characteristics of the reads themselves.
After alignment, you should evaluate additional metrics such as:
- Mapping percentage
- Properly paired reads
- Duplicate rate
- Coverage
- Insert size
- Strand specificity
- Gene-assignment rate
- Contamination
- Library complexity
For RNA-Seq, downstream QC may include:
STAR alignment statistics
↓
featureCounts assignment rate
↓
PCA
↓
Sample clustering
For WGS:
BWA alignment
↓
BAM statistics
↓
Coverage
↓
Duplicate metrics
↓
Variant quality
Think of FastQC as the first layer of NGS quality control, not the final layer.
FastQC vs MultiQC
These tools are complementary.
| Feature | FastQC | MultiQC |
|---|---|---|
| Analyze raw FASTQ characteristics | Yes | Reads FastQC outputs |
| Generate individual QC report | Yes | No |
| Summarize many samples | Limited | Yes |
| Cohort-level visualization | Limited | Strong |
| Integrate other pipeline tools | No | Yes |
| Best use | Individual-file QC | Project-level QC summary |
A typical workflow is:
FASTQ files
↓
FastQC
↓
Multiple FastQC reports
↓
MultiQC
↓
One combined project report
MultiQC can also aggregate reports from many other bioinformatics tools, which makes it useful throughout larger pipelines.
FastQC Tutorial: A Practical Decision-Making Workflow
Instead of asking:
Does my FastQC report contain red symbols?
ask these questions.
1. Is Overall Base Quality Acceptable?
If yes, continue.
If not, investigate low-quality regions.
2. Is Adapter Contamination Present?
If substantial, trim adapters.
3. Are Overrepresented Sequences Expected?
Determine whether they represent:
- Adapters
- Highly expressed transcripts
- rRNA
- Contamination
- Experimental targets
4. Is GC Distribution Biologically Reasonable?
Interpret according to:
- Organism
- Library type
- Metagenomic complexity
5. Is Duplication Expected?
Consider:
- RNA-Seq expression
- PCR amplification
- Targeted sequencing
- Library complexity
6. Are R1 and R2 Similar?
Check both independently.
7. Are Some Samples Different from the Rest?
Use MultiQC.
8. Does Preprocessing Actually Improve the Data?
Run FastQC again after trimming.
This approach is much more scientifically useful than treating FastQC as a simple pass/fail test.
Learn FastQC as Part of a Complete RNA-Seq Workflow
FastQC becomes most useful when you understand what happens after quality control.
For RNA-Seq, the progression is:
FASTQ
↓
FastQC
↓
Read Processing
↓
STAR / HISAT2
↓
BAM
↓
featureCounts
↓
DESeq2
↓
Differentially Expressed Genes
Learn this practically with:
Hands-On RNA-Seq Analysis: From FASTQ to Differential Expression
You can also read:
Learn FastQC as Part of Variant Calling
For genomic variant analysis:
FASTQ
↓
FastQC
↓
Read Preprocessing
↓
BWA
↓
BAM
↓
GATK / BCFtools
↓
VCF
↓
Variant Annotation
Continue with:
Learn Variant Calling: NGS Data Analysis
and read:
Learn FastQC as Part of Metagenomics
A metagenomics pipeline might look like:
FASTQ
↓
FastQC
↓
Read Quality Processing
↓
Host Read Removal
↓
Taxonomic Classification
↓
Abundance Estimation
↓
Functional Analysis
↓
Microbiome Interpretation
For this pathway, explore:
Master Metagenomics and Microbiome Data Analysis Using Linux
This is the most relevant BioInformatix individual course for readers interested in microbial NGS data.
Become an NGS Data Analyst with BioInformatix
FastQC is an essential skill, but professional NGS analysis requires understanding what happens before and after quality control.
You eventually need to connect:
FASTQ
↓
Quality Control
↓
Alignment / Quantification
↓
BAM or Count Matrix
↓
Statistical or Variant Analysis
↓
Biological Interpretation
For learners who want structured training across several major NGS workflows, the primary BioInformatix pathway is:
NGS & Transcriptomics Analyst Bundle: Master RNA-Seq, Variant Calling & Single-Cell Genomics
Instead of learning FastQC as an isolated command, this pathway helps place quality control within complete sequencing-analysis workflows.
You can build practical expertise across areas such as:
- RNA-Seq
- Variant calling
- Advanced transcriptomics
- Single-cell genomics
- Linux-based NGS analysis
- Public sequencing datasets
- Biological interpretation
For aspiring NGS Data Analysts, understanding the complete workflow is far more valuable than memorizing individual software commands.
Recommended FastQC and NGS Learning Roadmap
Stage 1 — Understand NGS
Read:
What Is Next-Generation Sequencing?
Stage 2 — Learn Linux
Start with the free:
Linux Command Line Essentials for Bioinformatics
FastQC and many other sequencing tools are commonly run through Linux command-line environments.
Stage 3 — Understand FASTQ Files
Learn:
- FASTQ structure
- Quality encoding
- Paired-end reads
- Compressed FASTQ files
Stage 4 — Practice FastQC
Run FastQC on:
R1
R2
and interpret each report.
Stage 5 — Learn MultiQC
Combine reports across multiple samples and identify outliers.
Stage 6 — Practice Read Preprocessing
Learn when and why to use:
- fastp
- Cutadapt
- Trimmomatic
Stage 7 — Choose a Complete NGS Workflow
Transcriptomics
Genomics
Microbiome
Master Metagenomics and Microbiome Data Analysis
Stage 8 — Develop Broader NGS Expertise
Continue through the:
NGS & Transcriptomics Analyst Bundle
Frequently Asked Questions
What is FastQC?
FastQC is a quality-control application used to examine high-throughput sequencing data and generate graphical reports showing read quality and sequence characteristics.
What is FastQC used for?
FastQC is used to inspect sequencing characteristics such as:
- Base quality
- Sequence quality
- GC content
- Adapter contamination
- Duplication
- Sequence composition
- Overrepresented sequences
Does FastQC modify FASTQ files?
No.
FastQC analyzes the data and generates reports. It does not trim or modify sequencing reads.
Can FastQC analyze .fastq.gz files?
Yes. FastQC supports gzip-compressed FASTQ files directly.
Do I need to unzip FASTQ files before FastQC?
Usually no.
You can run:
fastqc sample.fastq.gz
directly.
What does a red FastQC result mean?
A red result indicates that the module crossed FastQC’s predefined failure threshold.
It does not automatically mean the dataset is unusable.
Interpret the module according to the sequencing experiment.
Does every FastQC module need to pass?
No.
Some sequencing assays naturally generate warnings or failures in particular modules.
The objective is to understand whether the observed pattern is expected or technically problematic.
What is a good Phred score?
Q30 corresponds approximately to an error probability of 1 in 1,000 bases and is commonly considered high-quality sequencing.
However, appropriate quality expectations depend on the sequencing platform and downstream workflow.
Why does sequencing quality decrease near the read end?
Sequencing confidence can decrease across later sequencing cycles, especially in longer reads.
A modest decline does not automatically require trimming.
Why does RNA-Seq show high duplication?
Highly expressed transcripts can naturally generate many repeated sequencing reads.
High duplication is therefore not automatically a PCR artifact in RNA-Seq.
Why does RNA-Seq fail per-base sequence content?
Library-preparation and priming biases can produce non-random nucleotide composition, particularly near read starts.
Interpret this module in the context of the RNA-Seq protocol.
Should I always trim reads after FastQC?
No.
Only preprocess reads when the QC results and downstream workflow justify it.
What tools can remove sequencing adapters?
Common tools include:
- fastp
- Cutadapt
- Trimmomatic
Should I run FastQC again after trimming?
Yes.
Running FastQC again allows you to verify that the intended technical problem was improved.
What is MultiQC?
MultiQC aggregates outputs from FastQC and many other bioinformatics programs into a single project-level report.
What is the difference between FastQC and MultiQC?
FastQC analyzes individual sequencing files.
MultiQC summarizes outputs from many samples and tools.
Do I run FastQC before alignment?
Yes. Raw-read FastQC is normally performed before alignment.
Additional quality-control metrics should then be examined after alignment.
Is FastQC used in RNA-Seq?
Yes. FastQC is widely used at the beginning of RNA-Seq pipelines.
Is FastQC used in variant calling?
Yes. Raw-read quality assessment is an important early step in genomic variant-analysis workflows.
Is FastQC used in metagenomics?
Yes, although some FastQC modules—especially sequence composition and GC-content modules—must be interpreted carefully because metagenomic samples contain multiple organisms.
Final Thoughts
This FastQC Tutorial provides the foundation for evaluating raw NGS sequencing data before beginning downstream analysis.
The most important workflow to remember is:
Raw FASTQ
↓
FastQC
↓
Interpret the Report
↓
Preprocess Only if Necessary
↓
FastQC Again
↓
Downstream NGS Analysis
FastQC should help you answer questions such as:
- Are the base-quality scores acceptable?
- Does quality deteriorate strongly across the read?
- Are sequencing adapters present?
- Are unusual sequences overrepresented?
- Is sequence duplication expected?
- Does the GC profile make biological sense?
- Are R1 and R2 behaving similarly?
- Are some samples clearly different from the rest?
Most importantly:
Do not treat FastQC as a traffic-light system where green means usable and red means unusable.
Quality-control results must always be interpreted according to the library preparation, sequencing technology, organism, and downstream analysis.
If your goal is transcriptomics, continue with the Hands-On RNA-Seq Analysis course.
If your goal is genomic variant discovery, continue with Learn Variant Calling: NGS Data Analysis.
If you are working with microbial communities, continue with Master Metagenomics and Microbiome Data Analysis Using Linux.
For broader training across multiple sequencing workflows, follow the NGS & Transcriptomics Analyst Bundle as the primary learning pathway.