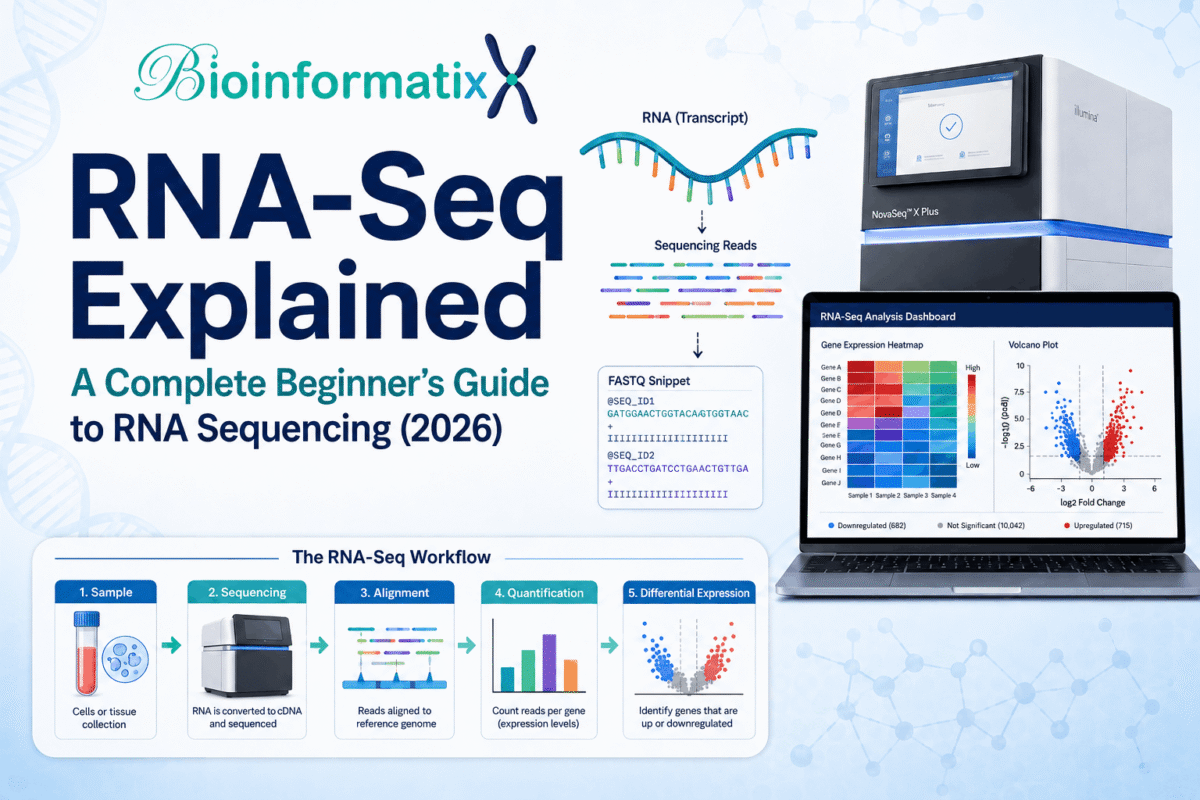
RNA-Seq is one of the most widely used applications of next-generation sequencing for studying gene expression and transcriptome biology. It allows researchers to measure RNA molecules across thousands of genes simultaneously and investigate how gene activity changes between tissues, diseases, treatments, developmental stages, or experimental conditions.
For bioinformaticians, RNA-Seq is especially important because it combines biological knowledge with Linux, sequence processing, statistical analysis, R programming, visualization, and functional interpretation.
In this complete beginner’s guide, you will learn:
- What RNA-Seq is
- How RNA sequencing works
- RNA-Seq vs microarray
- Bulk RNA-Seq vs single-cell RNA-Seq
- Different types of RNA sequencing
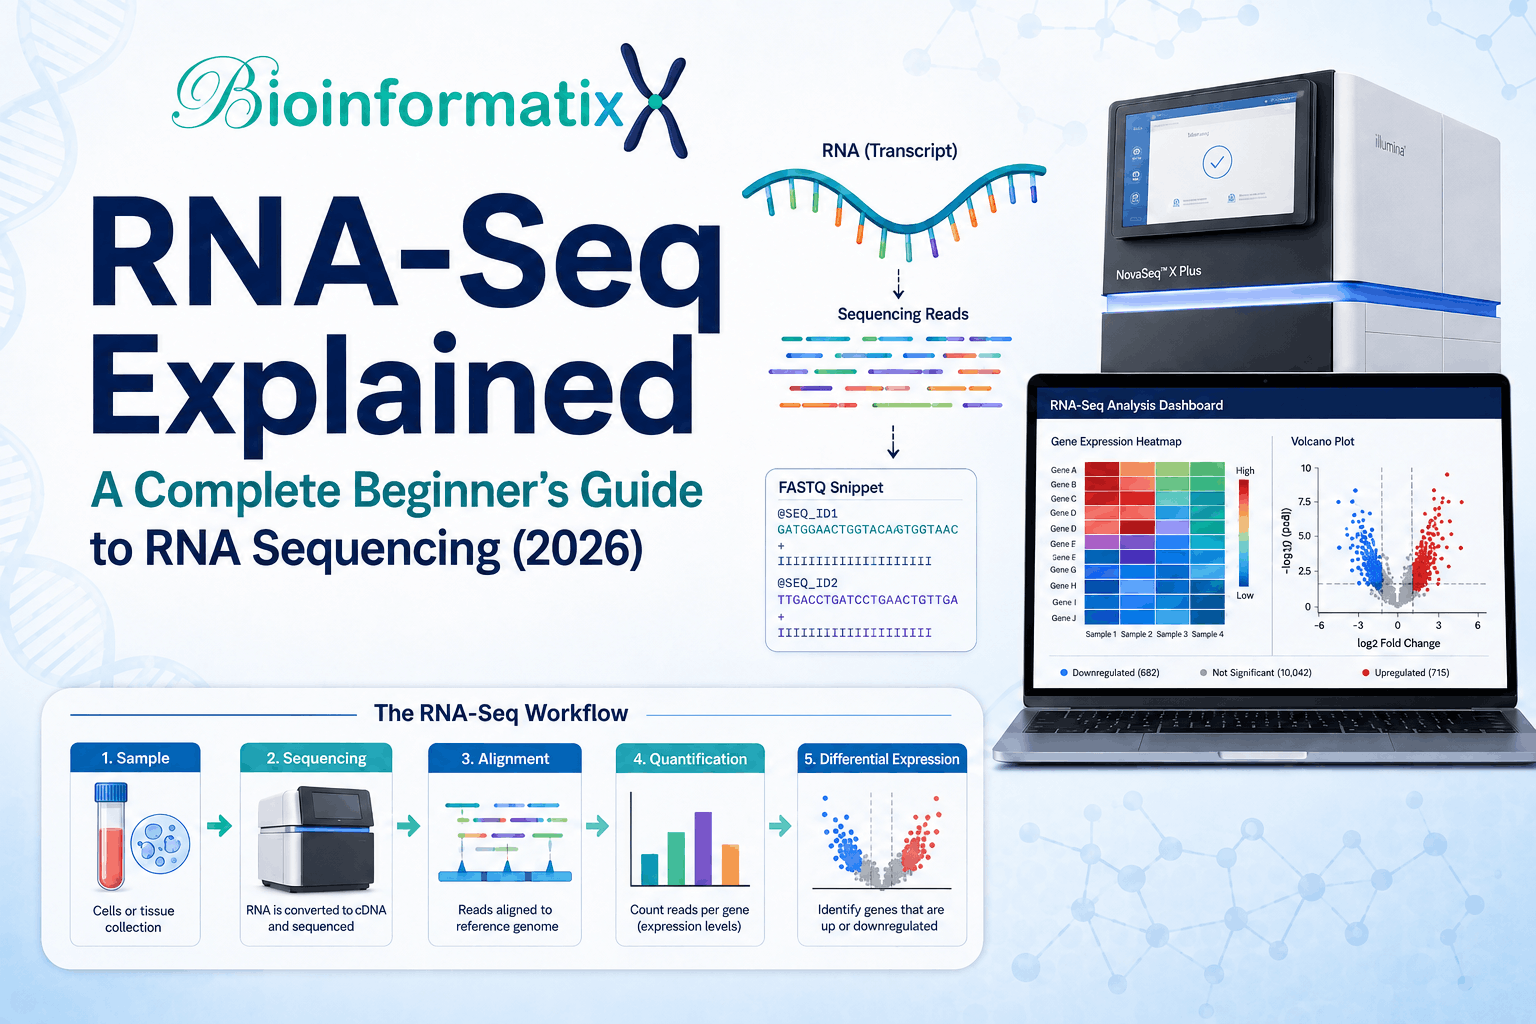
- The complete RNA-Seq workflow
- FASTQ quality control
- Read alignment
- Gene-expression quantification
- Differential expression analysis
- Common RNA-Seq tools
- RNA-Seq file formats
- How to obtain public RNA-Seq datasets
- Common beginner mistakes
- How to start learning RNA-Seq bioinformatics
RNA-Seq uses high-throughput sequencing to characterize the transcriptome and quantify RNA abundance on a genome-wide scale. (PubMed Central (PMC))
If you are new to sequencing, first read our What Is Next-Generation Sequencing (NGS)? Complete Beginner’s Guide.
What Is RNA-Seq?
RNA-Seq, short for RNA sequencing, is a next-generation sequencing technique used to study RNA molecules present in a biological sample.
Instead of measuring only predefined genes, RNA-Seq can provide a broad view of transcriptional activity across the genome.
Researchers can use RNA-Seq to investigate:
- Gene expression
- Differential gene expression
- Transcript abundance
- Alternative splicing
- Transcript isoforms
- Novel transcripts
- Non-coding RNAs
- Fusion transcripts
- Allele-specific expression
- RNA modifications in specialized workflows
The official Illumina RNA sequencing overview describes RNA-Seq as a family of sequencing approaches for profiling RNA from targeted transcripts through whole transcriptomes. (Illumina)
Why Is RNA-Seq Important?
Genes do not all remain equally active in every cell or condition.
A liver cell and a neuron contain essentially the same genome, but they express very different sets of genes.
RNA-Seq allows researchers to measure those differences.
For example, RNA-Seq can help answer questions such as:
- Which genes are highly expressed in cancer?
- Which genes decrease after drug treatment?
- Which pathways are activated during infection?
- Which genes respond to environmental stress?
- Which transcripts are specific to a tissue?
- Which genes differ between disease and healthy samples?
- Which non-coding RNAs may regulate a biological process?
Because of this flexibility, RNA-Seq is widely used in:
- Cancer biology
- Human genetics
- Immunology
- Neuroscience
- Plant science
- Microbiology
- Drug discovery
- Developmental biology
- Precision medicine
- Biomarker discovery
RNA-Seq vs Traditional Gene Expression Methods
Before RNA sequencing became widely adopted, gene-expression studies commonly used technologies such as:
- Quantitative PCR
- Northern blotting
- Microarrays
These methods remain useful, but RNA-Seq provides several advantages for transcriptome-scale research.
RNA-Seq vs qPCR
qPCR is highly effective when you already know which genes you want to measure.
For example, you may measure expression of:
TP53
BRCA1
MYC
EGFR
But qPCR becomes difficult when you want to investigate thousands of genes simultaneously.
RNA-Seq allows genome-wide analysis without restricting the experiment to only a few selected targets.
RNA-Seq vs Microarray
Microarrays measure RNA abundance using predefined probes.
RNA-Seq instead sequences RNA-derived molecules, allowing a broader investigation of the transcriptome.
| Feature | Microarray | RNA-Seq |
|---|---|---|
| Requires predefined probes | Yes | No |
| Novel transcript discovery | Limited | Yes |
| Gene-expression measurement | Yes | Yes |
| Alternative transcript analysis | Limited | Stronger |
| Dynamic range | More limited | Generally broader |
| Raw data type | Image/intensity | Sequencing reads |
RNA-Seq has become a major method for transcriptome profiling because it can quantify known transcripts while also supporting discovery of previously uncharacterized transcriptional features. (PubMed Central (PMC))
How Does RNA-Seq Work?
A simplified RNA-Seq experiment can be represented as:
Biological Sample
↓
RNA Extraction
↓
RNA Selection or Depletion
↓
Library Preparation
↓
Sequencing
↓
FASTQ Files
↓
Bioinformatics Analysis
↓
Biological Interpretation
The wet-lab workflow generates the sequencing data.
The bioinformatics workflow converts those reads into biologically meaningful results.
Step 1: Collect the Biological Samples
The first step is selecting the biological material relevant to the research question.
Examples include:
- Tumor tissue
- Healthy tissue
- Blood
- Plant leaves
- Bacterial cultures
- Cell lines
- Brain tissue
- Immune cells
A good experimental design should include appropriate biological replicates.
For example:
Control 1
Control 2
Control 3

Disease 1
Disease 2
Disease 3
Replication is critical because biological variability must be estimated during statistical analysis.
Step 2: Extract RNA
RNA is isolated from each biological sample.
Depending on the experiment, researchers may focus on:
- Total RNA
- Messenger RNA
- Small RNAs
- Long non-coding RNAs
- Ribosome-depleted RNA
RNA quality can strongly influence sequencing results.
Poor-quality RNA may produce biased or incomplete transcriptome information.
Step 3: Select the RNA Population
Total RNA contains several classes of RNA.
A large proportion may consist of ribosomal RNA.
Depending on the experiment, researchers may use:
Poly(A) Selection
Enriches RNA molecules with poly(A) tails.
This is commonly used for messenger RNA studies.
Ribosomal RNA Depletion
Removes abundant ribosomal RNA.
This can retain a broader set of RNA types, including some non-coding RNAs.
Small RNA Selection
Used when studying:
- miRNAs
- Small regulatory RNAs
- Other short RNA molecules
The library strategy must match the biological question.
Step 4: Prepare the Sequencing Library
The RNA is generally converted into sequencing-compatible molecules.
Library preparation can involve:
- RNA fragmentation
- Reverse transcription
- cDNA synthesis
- Adapter ligation
- PCR amplification
- Indexing
- Size selection
The prepared library is then loaded onto the sequencing instrument.
Single-End vs Paired-End RNA-Seq
RNA-Seq data may be generated as single-end or paired-end reads.
Single-End Sequencing
One end of each library fragment is sequenced.
You may receive a file such as:
sample1.fastq.gz
Paired-End Sequencing
Both ends of each fragment are sequenced.
You may receive:
sample1_R1.fastq.gz
sample1_R2.fastq.gz
Paired-end reads can provide additional information about:
- Transcript structure
- Splice junctions
- Mapping confidence
- Insert size
- Isoforms
The correct choice depends on experimental objectives, sequencing depth, read length, and budget.
Stranded vs Unstranded RNA-Seq
Another important concept is library strandedness.
In a stranded RNA-Seq library, information is retained about which DNA strand the original RNA transcript came from.
This is valuable when:
- Genes overlap
- Antisense transcription exists
- Non-coding RNAs are studied
- Accurate transcript quantification is required
If your library is stranded, the downstream analysis must use the correct strandedness settings.
Using the wrong setting during quantification can produce incorrect gene counts.
Major Types of RNA-Seq
RNA sequencing includes several specialized experimental designs.
Bulk RNA-Seq
Bulk RNA-Seq measures average RNA expression across a population of cells.
For example:
Tumor tissue
↓
Thousands or millions of cells
↓
One combined expression profile
Bulk RNA-Seq is widely used because it is relatively established, accessible, and powerful for comparing biological conditions.
Applications include:
- Disease vs control
- Treatment response
- Gene-expression profiling
- Biomarker discovery
- Pathway analysis
For practical training, explore:
Hands-On RNA-Seq Analysis Crash Course: From FASTQ to Differential Expression
The current course takes learners through public-data retrieval, FASTQ preprocessing, alignment, quantification, DESeq2-based differential expression, enrichment analysis, and a capstone workflow. (bioinformatix.co)
Single-Cell RNA-Seq
Single-cell RNA sequencing measures gene expression at the level of individual cells.
Instead of:
One expression profile per tissue
you may obtain:
Thousands of expression profiles
one for each cell
This allows researchers to investigate:
- Cell populations
- Rare cell types
- Cellular heterogeneity
- Cell states
- Tumor subpopulations
- Developmental trajectories
Single-cell approaches can reveal variation that is masked when thousands of cells are averaged together in bulk RNA-Seq. (Illumina)
Learn the computational workflow through:
Learn Single-Cell RNA-Seq Data Analysis Using R and Python
The BioInformatix course currently covers Seurat, Scanpy, quality control, normalization, dimensionality reduction, clustering, marker identification, and cell-type annotation using real public datasets. (bioinformatix.co)
Long Non-Coding RNA Sequencing
Long non-coding RNAs, commonly called lncRNAs, are transcripts longer than approximately 200 nucleotides that generally do not encode conventional proteins.
lncRNAs can participate in:
- Transcriptional regulation
- Chromatin organization
- Development
- Cancer biology
- Cell signaling
Analyzing lncRNAs may involve:
- Read alignment
- Transcript assembly
- Transcript classification
- Expression quantification
- Differential expression
- Functional interpretation
For this area, BioInformatix offers:
Learn Advanced Transcriptomics: lncRNA, miRNA & Psi-Seq Data Analysis
The current course includes practical lncRNA-Seq, miRNA-Seq, and pseudouridine-sequencing workflows using Linux-based pipelines. (bioinformatix.co)
miRNA-Seq
MicroRNAs are short regulatory RNA molecules involved in post-transcriptional gene regulation.
miRNA sequencing can be used to:
- Quantify known miRNAs
- Identify differential miRNA expression
- Discover candidate novel miRNAs
- Study regulatory networks
- Investigate disease biomarkers
The analytical workflow differs from standard messenger RNA sequencing because small RNAs require specialized preprocessing and mapping strategies.
Long-Read RNA-Seq
Long-read RNA sequencing can capture much longer transcript molecules and can help researchers investigate full-length transcript isoforms and splice patterns.
This is particularly useful for:
- Alternative splicing
- Full-length transcript identification
- Isoform discovery
- Complex transcript structures
Long-read RNA-Seq can preserve splice-junction combinations within individual long transcript molecules. (encodeproject.org)
Complete RNA-Seq Data Analysis Workflow
A typical bulk RNA-Seq analysis workflow may look like:
FASTQ
↓
Quality Control
↓
Read Preprocessing
↓
Reference Genome Preparation
↓
Read Alignment
↓
SAM/BAM
↓
Gene Quantification
↓
Count Matrix
↓
Normalization
↓
Differential Expression
↓
Visualization
↓
Functional Enrichment
↓
Biological Interpretation
The exact workflow varies according to library type and analytical objectives.
Step 1: Obtain the RNA-Seq Data
RNA-Seq data may come directly from a sequencing facility.
You may receive files such as:
Control1_R1.fastq.gz
Control1_R2.fastq.gz

Control2_R1.fastq.gz
Control2_R2.fastq.gz

Disease1_R1.fastq.gz
Disease1_R2.fastq.gz
You can also download public sequencing datasets.
Important repositories include:
- NCBI GEO
- NCBI SRA
- European Nucleotide Archive
The NCBI Sequence Read Archive provides public access to high-throughput sequencing data. (NCBI)
For a complete public-data workflow, read our:
GEO Database Tutorial & SRA Database Guide
Step 2: RNA-Seq Quality Control
Before alignment or quantification, inspect the sequencing reads.
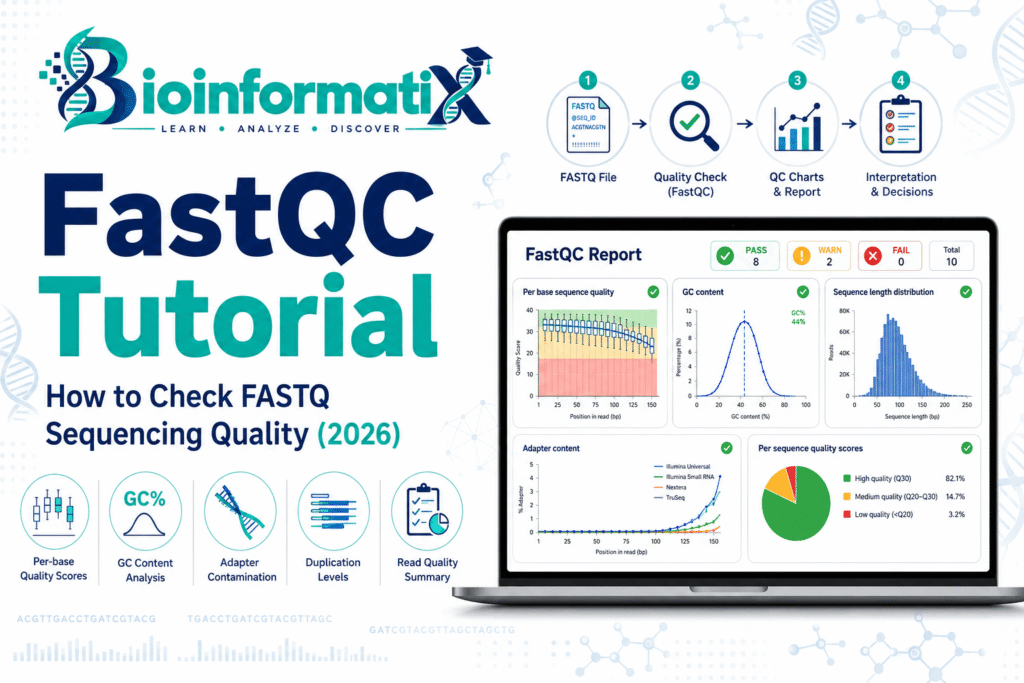
Common quality metrics include:
- Per-base sequence quality
- GC content
- Adapter contamination
- Read length
- Sequence duplication
- Overrepresented sequences
- Low-quality bases
A commonly used tool is:
FastQC
You may also combine quality reports across many samples using:
MultiQC
Quality control should be performed before deciding whether trimming or filtering is necessary.
Our future NGS-cluster article will cover:
FastQC Tutorial: How to Check FASTQ Sequencing Quality
Step 3: Read Trimming and Preprocessing
Raw reads may contain:
- Sequencing adapters
- Low-quality bases
- Very short reads
- Technical contamination
Popular preprocessing tools include:
- fastp
- Cutadapt
- Trimmomatic
A simplified workflow is:
Raw FASTQ
↓
Quality Control
↓
Adapter/quality processing
↓
Clean FASTQ
Avoid aggressive trimming without examining the quality report first.
Removing too much sequence can reduce mapping performance.
Step 4: Download the Reference Genome and Annotation
Most alignment-based RNA-Seq workflows require:
Reference Genome
Usually downloaded in FASTA format.
Example:
genome.fa
Gene Annotation
Usually downloaded in:
GTF
or:
GFF3
The annotation defines:
- Genes
- Transcripts
- Exons
- Coding regions
You can obtain genome annotations from resources such as Ensembl.
Read our Ensembl Genome Browser Guide to understand genes, transcripts, and annotation files.
Step 5: Align RNA-Seq Reads
RNA-Seq alignment is more complex than standard genomic read alignment because transcript reads may span exon-exon junctions.
Common splice-aware aligners include:
- STAR
- HISAT2
A simplified alignment workflow is:
FASTQ
+
Reference genome
↓
Alignment
↓
SAM/BAM
A good aligner can recognize reads that span splice junctions.
Future articles in this cluster will cover:
- STAR Aligner Tutorial
- HISAT2 Tutorial
What Is STAR?
STAR is a splice-aware aligner widely used in RNA-Seq workflows.
It can map reads across exon junctions and is frequently used in bulk and single-cell sequencing pipelines.
A typical workflow requires:
- Reference genome
- Gene annotation
- STAR genome index
- FASTQ reads
- Alignment
- BAM output
What Is HISAT2?
HISAT2 is another splice-aware aligner used for RNA sequencing.
It is designed to efficiently map sequencing reads to reference genomes while supporting spliced alignments.
The choice between STAR and HISAT2 depends on:
- Computational resources
- Pipeline design
- Dataset size
- Downstream requirements
There is no universal rule that one aligner is always superior for every RNA-Seq experiment.
Step 6: Work with SAM and BAM Files
Alignment results are commonly stored as:
- SAM
- BAM
- CRAM
SAM is text-based.
BAM is a compressed binary format.
A common tool used to manipulate BAM files is:
SAMtools
Typical operations include:
- Sorting
- Indexing
- Viewing
- Filtering
- Extracting statistics
A simplified workflow might be:
SAM
↓
BAM
↓
Sorted BAM
↓
Indexed BAM
Understanding these formats is essential for NGS analysis.
Step 7: Quantify Gene Expression
After alignment, you need to determine how many sequencing reads are associated with each gene.
A commonly used tool is:
featureCounts
Other options include:
- HTSeq
- Salmon
- kallisto
Alignment-based gene counting may produce a table such as:
| Gene | Control 1 | Control 2 | Disease 1 | Disease 2 |
|---|---|---|---|---|
| GeneA | 115 | 121 | 780 | 821 |
| GeneB | 430 | 401 | 155 | 149 |
| GeneC | 75 | 80 | 82 | 77 |
This is known as a count matrix.
The count matrix becomes the input for downstream statistical analysis.
Raw Counts vs TPM vs FPKM
Beginners frequently become confused by expression units.
Three terms you may encounter are:
- Raw counts
- TPM
- FPKM
Raw Counts
Represent the number of sequencing fragments or reads assigned to a feature according to the selected quantification method.
Raw counts are commonly used as input for count-based differential-expression packages such as DESeq2.
TPM
TPM stands for Transcripts Per Million.
It normalizes expression according to gene length and sequencing depth and is often useful when comparing relative expression levels.
FPKM
FPKM stands for Fragments Per Kilobase of transcript per Million mapped reads.
It has historically been used for expression normalization, particularly in paired-end datasets.
For differential expression, do not simply replace raw count input with TPM or FPKM unless your statistical method explicitly expects those values.
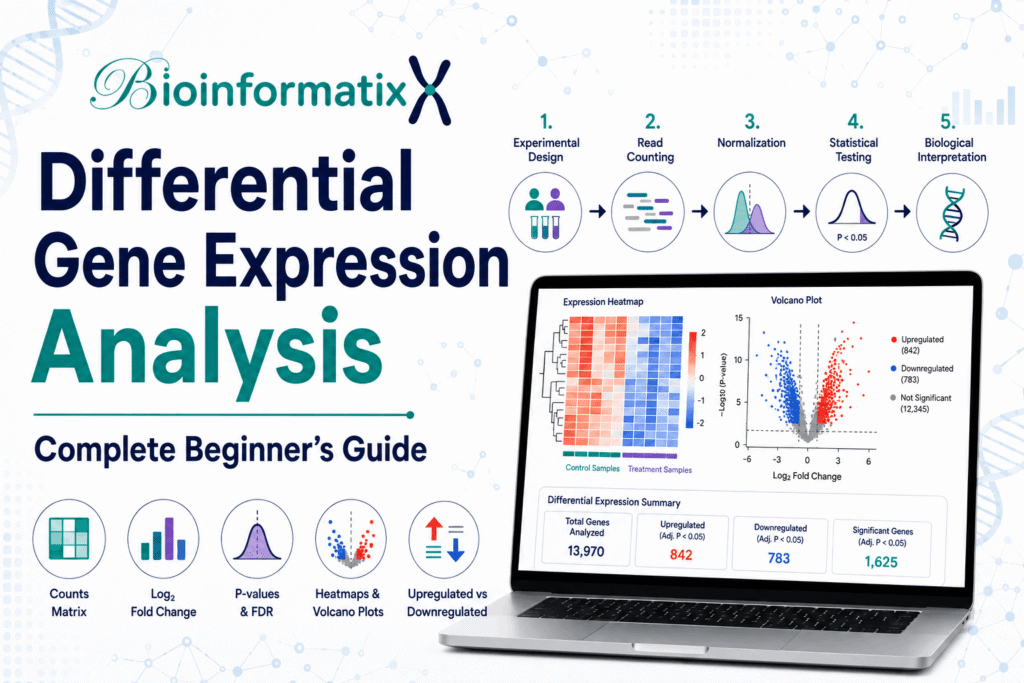
Step 8: Differential Gene Expression Analysis
One of the most common goals of RNA-Seq is identifying genes whose expression differs significantly between biological groups.
For example:
Cancer
vs
Healthy
or:
Drug-treated
vs
Untreated
Popular R packages include:
- DESeq2
- edgeR
- limma-based workflows
A typical result contains:
| Gene | log2FC | p-value | Adjusted p-value |
|---|---|---|---|
| GeneA | 2.4 | 0.0001 | 0.002 |
| GeneB | -1.8 | 0.0007 | 0.006 |
| GeneC | 0.2 | 0.48 | 0.72 |
What Is Log2 Fold Change?
Log2 fold change describes the direction and magnitude of expression change.
For example:
log2FC = +2
indicates increased expression.
log2FC = -2
indicates decreased expression.
However, fold change alone is not sufficient.
Statistical significance must also be evaluated.
Adjusted P-Value
RNA-Seq tests thousands of genes simultaneously.
Testing many genes increases the probability of false positives.
For this reason, differential-expression pipelines usually apply multiple-testing correction.
The adjusted p-value is often used when identifying statistically significant genes.
Step 9: RNA-Seq Visualization
Visualization is an important part of RNA-Seq analysis.
Common plots include:
PCA Plot
Principal Component Analysis can reveal:
- Sample clustering
- Experimental separation
- Outliers
- Batch effects
Ideally, biological replicates often cluster together when the underlying biology produces a strong signal.
Volcano Plot
A volcano plot combines:
- Statistical significance
- Expression fold change
It can highlight:
- Upregulated genes
- Downregulated genes
- Non-significant genes
Heatmap
Heatmaps visualize gene-expression patterns across samples.
They are frequently used for:
- Differentially expressed genes
- Clustering
- Biomarker signatures
- Sample comparison
MA Plot
An MA plot shows expression changes in relation to average abundance.
It is commonly used during differential-expression analysis.
Step 10: Functional Enrichment Analysis
A list of differentially expressed genes is only the beginning.
Researchers usually want to understand what the genes do.
Common downstream analyses include:
- Gene Ontology enrichment
- KEGG pathway analysis
- Reactome pathways
- Gene Set Enrichment Analysis
- Protein interaction networks
For example, a disease dataset might show enrichment in:
- Cell cycle
- DNA repair
- Immune response
- Apoptosis
- Metabolism
This converts statistical results into biological interpretation.
RNA-Seq Data Analysis Tools
A beginner may encounter the following tools.
Quality Control
- FastQC
- MultiQC
Read Processing
- fastp
- Cutadapt
- Trimmomatic
Alignment
- STAR
- HISAT2
Alignment Processing
- SAMtools
Quantification
- featureCounts
- HTSeq
- Salmon
- kallisto
Differential Expression
- DESeq2
- edgeR
- limma
Functional Analysis
- clusterProfiler
- Gene Ontology tools
- pathway-analysis resources
Do not try to master every tool simultaneously.
Learn one complete workflow first.
Alignment-Based vs Alignment-Free RNA-Seq
Not every RNA-Seq pipeline requires conventional genome alignment.
Alignment-Based Workflow
A classical workflow is:
FASTQ
↓
STAR / HISAT2
↓
BAM
↓
featureCounts
↓
Count matrix
This approach provides detailed genomic alignment information.
Transcript Quantification Workflow
Tools such as:
- Salmon
- kallisto
can quantify transcript abundance using approaches that avoid conventional full genome alignment.
A simplified workflow is:
FASTQ
↓
Transcriptome index
↓
Quantification
↓
Transcript abundance
The best approach depends on the biological question and downstream analysis.
Bulk RNA-Seq vs Single-Cell RNA-Seq
| Feature | Bulk RNA-Seq | Single-Cell RNA-Seq |
|---|---|---|
| Resolution | Sample/tissue | Individual cells |
| Expression profile | Average | Cell specific |
| Cell heterogeneity | Mostly hidden | Detectable |
| Data complexity | Moderate | High |
| Typical analysis | DESeq2/edgeR | Seurat/Scanpy |
| Clustering | Samples | Cells |
| Cell-type annotation | Not usually | Central task |
Bulk RNA-Seq remains extremely useful for many experiments.
Single-cell RNA-Seq is more appropriate when cellular heterogeneity itself is central to the biological question.
RNA-Seq and Advanced Transcriptomics
RNA sequencing now extends beyond standard mRNA differential expression.
Advanced transcriptomics includes areas such as:
- lncRNA analysis
- miRNA profiling
- Alternative splicing
- RNA modification
- Isoform analysis
- Long-read transcriptomics
BioInformatix learners who have already mastered standard RNA-Seq can continue with:
Learn Advanced Transcriptomics: lncRNA, miRNA & Psi-Seq Data Analysis
The current course includes complete workflows for lncRNA analysis, miRNA profiling with miRDeep2, and pseudouridine-site analysis. (bioinformatix.co)
Public RNA-Seq Datasets
You do not need your own sequencing experiment to learn RNA-Seq.
Thousands of datasets are publicly available.
Important resources include:
- GEO
- SRA
- ENA
A practical learning workflow might be:
- Search GEO.
- Identify a suitable GSE study.
- Review GSM sample metadata.
- Identify the corresponding SRA accessions.
- Download FASTQ files.
- Perform quality control.
- Align the reads.
- Quantify expression.
- Run differential-expression analysis.
- Interpret the results.
Read our:
GEO Database Tutorial & SRA Database Guide
before beginning a public-data analysis project.
Why Linux Is Important for RNA-Seq
Many RNA-Seq tools are used through the command line.
Linux skills help you:
- Manage FASTQ files
- Download reference genomes
- Install software
- Run FastQC
- Execute STAR or HISAT2
- Manipulate BAM files
- Run featureCounts
- Automate analyses
- Work on HPC systems
If you have never used Linux, begin with the free:
Linux Command Line Essentials for Bioinformatics
You can also read our Linux for Bioinformatics Guide.
Why R Is Important for RNA-Seq
R is central to downstream transcriptomics analysis.
It is commonly used for:
- DESeq2
- edgeR
- Visualization
- PCA
- Volcano plots
- Heatmaps
- Gene-set enrichment
- Statistical analysis
Beginners can read:
R Programming for Bioinformatics: A Complete Beginner’s Guide
For structured training in R, Linux, and Python together, explore:
Learn Bioinformatics Data Analysis: Master Python, Linux and R Scripting
Common RNA-Seq Mistakes Beginners Should Avoid
Ignoring Experimental Design
Do not begin analysis until you understand:
- Control group
- Treatment group
- Biological replicates
- Organism
- Tissue
- Library strategy
- Sequencing layout
Mixing Paired-End Files
If data are paired-end:
R1
must remain paired with:
R2
for the same sequencing run.
Using the Wrong Reference Genome
The reference genome and annotation must correspond to the same assembly.
For example, mixing annotation from one genome assembly with FASTA from another can create serious problems.
Ignoring Strandedness
Incorrect strandedness settings during quantification may dramatically affect gene counts.
Skipping Quality Control
Always inspect the reads before alignment or quantification.
Treating TPM as Raw Counts
DESeq2 workflows typically require count data appropriate for its count-based statistical model.
Ignoring Batch Effects
Samples may differ because of:
- Sequencing batch
- Laboratory batch
- Library preparation
- Sample collection
- Technical conditions
These effects can confound biological interpretation.
Removing Outliers Without Investigation
Do not remove a sample simply because it looks different.
First determine why it is different.
Using Only P-Values
A gene may be statistically significant but have a very small biological effect.
Consider both:
- Statistical significance
- Effect size
Stopping at the DEG List
RNA-Seq analysis should not end after producing a spreadsheet of genes.
Continue to:
- Functional enrichment
- Pathway analysis
- Network analysis
- Biological interpretation
Is RNA-Seq Difficult to Learn?
RNA-Seq can seem complicated because it combines several areas:
- Molecular biology
- Next-generation sequencing
- Linux
- Statistics
- R programming
- Biological databases
- Data visualization
The easiest way to learn is sequentially.
Start with:
FASTQ
then learn:
Quality Control
then:
Alignment
then:
Quantification
then:
Differential Expression
and finally:
Biological Interpretation
Trying to learn every tool simultaneously usually makes the process harder.
Learn RNA-Seq with BioInformatix
If your main goal is to learn standard bulk RNA-Seq from the beginning, start with:
Hands-On RNA-Seq Analysis Crash Course: From FASTQ to Differential Expression
The course currently covers the workflow from public dataset retrieval and FASTQ preprocessing through alignment, BAM quantification, DESeq2 analysis, gene-set enrichment, and practical assignments. (bioinformatix.co)
It is designed for learners who want hands-on experience rather than only theoretical knowledge.
Move Beyond Standard RNA-Seq
Once you understand bulk RNA-Seq, you can progress into more specialized transcriptomics.
Advanced Transcriptomics
Learn:
- lncRNA-Seq
- miRNA-Seq
- RNA modifications
- Transcript assembly
- Advanced Linux workflows
Course:
Learn Advanced Transcriptomics: lncRNA, miRNA & Psi-Seq Data Analysis
Single-Cell Transcriptomics
Learn:
- Seurat
- Scanpy
- Quality control
- PCA
- UMAP
- Clustering
- Marker genes
- Cell-type annotation
Course:
Learn Single-Cell RNA-Seq Data Analysis Using R and Python
Become an NGS & Transcriptomics Analyst
If you want broader expertise instead of learning RNA-Seq in isolation, the strongest learning pathway is the:
NGS & Transcriptomics Analyst Bundle: Master RNA-Seq, Variant Calling & Single-Cell Genomics
The BioInformatix bundle is designed as a broader NGS learning pathway, combining RNA-Seq with additional areas including variant calling, ChIP-Seq/scATAC-Seq, and single-cell genomics. (bioinformatix.co)
This is the recommended option if your goal is to build a more complete NGS Data Analyst skill set rather than specialize immediately in only one transcriptomics workflow.
Recommended RNA-Seq Learning Roadmap
A beginner can follow this progression:
Stage 1: Understand NGS
Read:
What Is Next-Generation Sequencing? Complete Beginner’s Guide
Stage 2: Learn Linux
Complete:
Linux Command Line Essentials for Bioinformatics
Stage 3: Learn Public Dataset Retrieval
Read:
GEO Database Tutorial & SRA Database Guide
Stage 4: Learn Bulk RNA-Seq
Complete:
Stage 5: Learn Advanced Transcriptomics
Complete:
Learn Advanced Transcriptomics
Stage 6: Learn Single-Cell RNA-Seq
Complete:
Learn Single-Cell RNA-Seq Using R and Python
Stage 7: Build Broader NGS Expertise
Follow the:
NGS & Transcriptomics Analyst Bundle
Frequently Asked Questions
What does RNA-Seq stand for?
RNA-Seq stands for RNA sequencing.
What is RNA-Seq used for?
RNA-Seq is used to investigate gene expression, transcript abundance, alternative transcripts, non-coding RNA, differential gene expression, and other aspects of transcriptome biology.
Is RNA-Seq part of NGS?
Yes. RNA-Seq is one of the major applications of next-generation sequencing.
What is the starting file for RNA-Seq analysis?
Most sequencing-based RNA-Seq workflows begin with FASTQ files.
Which aligner is used for RNA-Seq?
Common splice-aware aligners include STAR and HISAT2.
What is featureCounts?
featureCounts is a program commonly used to assign aligned sequencing reads to genomic features such as genes.
What is DESeq2?
DESeq2 is an R/Bioconductor package commonly used for differential-expression analysis of count data.
What is a DEG?
DEG stands for differentially expressed gene.
It refers to a gene whose expression differs statistically between experimental groups according to the selected analysis criteria.
Is RNA-Seq better than microarray?
RNA-Seq provides broader transcriptome coverage and does not depend on predefined probe sets, but microarrays remain useful for many existing datasets and research applications.
What is bulk RNA-Seq?
Bulk RNA-Seq measures average RNA expression across a mixed population of cells.
What is single-cell RNA-Seq?
Single-cell RNA-Seq measures gene expression in individual cells.
Do I need Linux for RNA-Seq?
Linux is highly recommended because many standard RNA-Seq tools are command-line based.
Do I need R for RNA-Seq?
R is extremely useful for downstream analysis, especially differential expression, statistics, and visualization.
Where can I download free RNA-Seq datasets?
Public RNA-Seq datasets are commonly available through GEO, SRA, and ENA.
Can beginners learn RNA-Seq?
Yes. The most effective approach is to learn the workflow stage by stage and practice on real public datasets.
Final Thoughts
RNA-Seq is one of the most important technologies in modern transcriptomics and bioinformatics.
It allows researchers to move from biological samples to genome-wide measurements of transcriptional activity and ultimately identify genes, pathways, and regulatory processes associated with biological conditions.
A typical workflow can be summarized as:
FASTQ → Quality Control → Preprocessing → Alignment → BAM → Quantification → Count Matrix → Differential Expression → Functional Analysis
For beginners, the key is not to memorize commands.
Understand what happens at every stage.
Learn:
- Why quality control matters
- Why reference genome selection matters
- How RNA reads are aligned
- How genes are quantified
- How normalization works
- How differential expression is tested
- How statistical results are interpreted biologically
If your immediate goal is practical bulk transcriptomics, start with the Hands-On RNA-Seq Analysis Crash Course.
Once you master the standard workflow, progress into Advanced Transcriptomics and Single-Cell RNA-Seq.
For learners who want a broader career-oriented pathway covering several high-value NGS workflows, use the NGS & Transcriptomics Analyst Bundle as the main learning path.